Orders, lines and waves
Timestamped demand, SKU velocity, order size, cutoff logic, cancellations and replenishment.
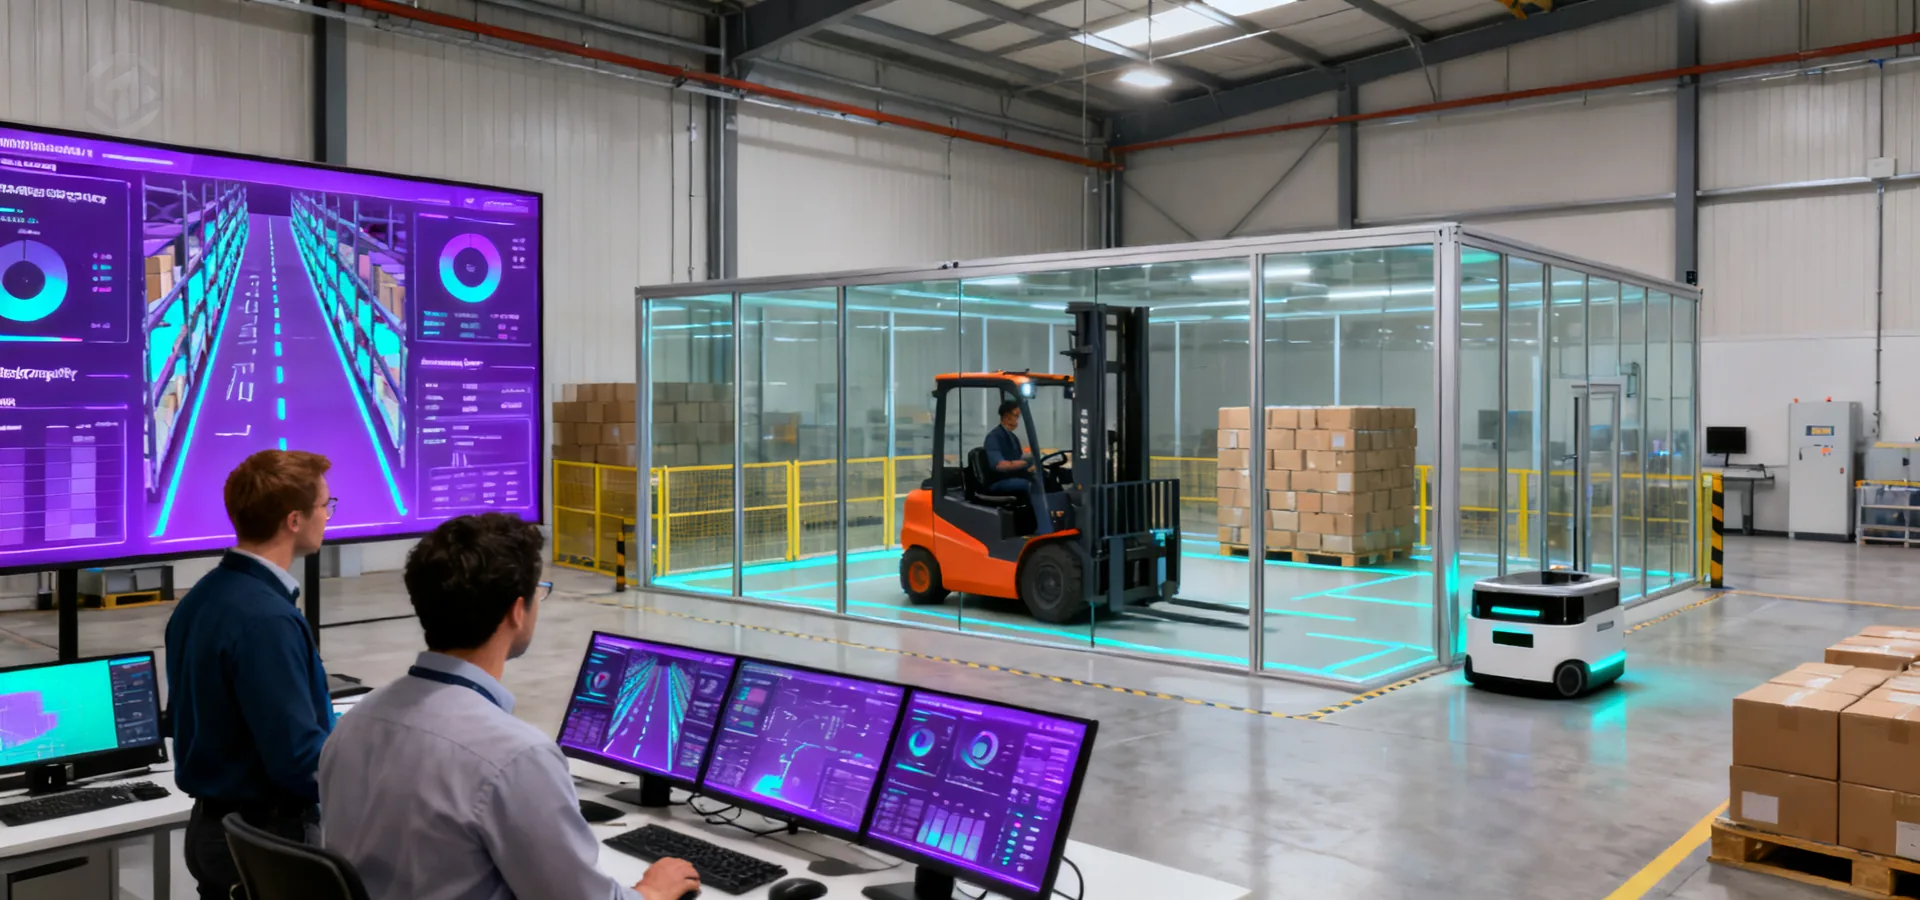
Expose throughput assumptions, traffic timing and recovery paths before the live warehouse becomes the test environment. Models remain useful only when their inputs, simplifications and acceptance links are visible.
Inspect the input contractThe input contract names source, period, owner, unit and treatment for each dataset. Order history is separated from forecast scenarios. Physical travel distance is separated from nominal truck speed. Failure and recovery assumptions sit beside the responsible control layer.
Missing information is not silently replaced by a favorable default. It is marked as an assumption with a sensitivity test, an owner and a date for confirmation so later design changes stay traceable.
Timestamped demand, SKU velocity, order size, cutoff logic, cancellations and replenishment.
Rated load, load center, aisle clear width, rack geometry, floor condition and station envelope.
Priorities, batching, charging, blocked destinations, retry limits and manual interventions.
WMS, WCS, WES, PLC and fleet messages, cycle time, confirmations, timeouts and ownership.
Every reported output carries the scenario identifier, input revision and observation period. A result is interpreted inside that boundary rather than promoted as a universal system rate.
Tests normal SKU and order distributions, replenishment, breaks and routine aisle variability before peak or failure cases are introduced.
Raises release demand for the defined duration while retaining realistic downstream capacity, separating a burst from stable shipping-window output.
Removes a route, transfer point or truck and applies the agreed response so failure isolation and recovery time stay measurable.
Emulated devices respond to commands, delay confirmations and inject defined faults so interface behavior can be reviewed ahead of site commissioning. The method is useful for message structure and state transitions; it cannot prove wireless coverage, physical sensor performance or real load stability.
A documented responsibility matrix identifies which layer detects each condition, which layer decides the next state and who authorizes a restart.
Simulation does not replace physical acceptance. It narrows which residual capacity, traffic and recovery cases must appear in factory and site gates.
Every twin input that lacks a measured source is tagged with owner, due date and sensitivity. Closed assumptions become part of the RFQ baseline.
Scenario outputs that depend on truck configuration map to factory checks for residual capacity (kg @ mm), stability, scanner fields and interface handshake cycle time in seconds.
Site geometry (aisle clear width mm), floor condition, charging parks and live traffic rules are confirmed under the same scenario identifiers. Example envelope (project-approved, not a Hangcha claim): 120-minute nominal duty, then blocked-aisle, charger-loss and host-timeout cases with measured recovery minutes and availability %.
After any aisle, battery or control-rule change, the twin revision and affected acceptance gates are reopened together.
Share load unit, SKU and order profile, peak rate, interfaces and site constraints so the lab can build a bounded scenario deck instead of a decorative animation.
Book a twin review